The Truth about Oil Supply-Demand Dynamics
Oil is a very inelastic good. In a typical supply-demand relationship, as prices go up, demand falls off and producers lower prices to re-incentivize buyers.
However, demand for oil is far less sensitive to price fluctuations because, well, people need gas.
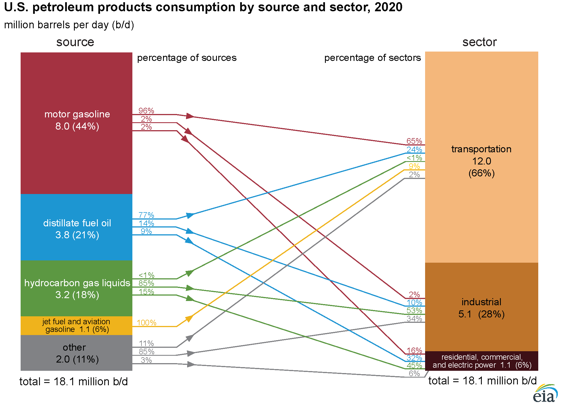
There are numerous products made from oil and petroleum (a derivative of crude) — although gasoline does drive a big chunk of U.S. demand.
You can see just how inelastic oil demand is from the outperformance of energy prices relative to other CPI metrics.
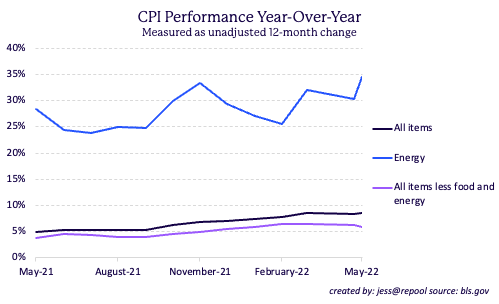
As a result, it can be extremely difficult to combat periods of intense energy price inflation.
Even though electric vehicles (mostly Tesla) have come a long way, this is not nearly enough to replace fossil fuels. The world runs on crude.
Market Benchmarks
There are many, many different kinds of crude oil produced around the world. However, the term “crude” usually refers to either West Texas Intermediate (WTI) or Brent crude.
WTI is the benchmark for North American oil, it is largely sourced from the Permian basin in West Texas. Brent is the international benchmark, it is sourced from the North Sea and rose to prominence in the 80s-90s when production boomed in this region.
Dubai/Oman is another major crude benchmark. This is the standard for Middle Eastern oil pricing. Notably, in 2018, Saudi Aramco began experimenting with Oman futures as a pricing input to their production.
The vast majority of speculative trading, hedging, and product pricing is centered around these three indices.
Who are the major players?
The U.S. currently leads the pack in oil production and consumption. Until recently, we were also a massive net importer of crude and petroleum.
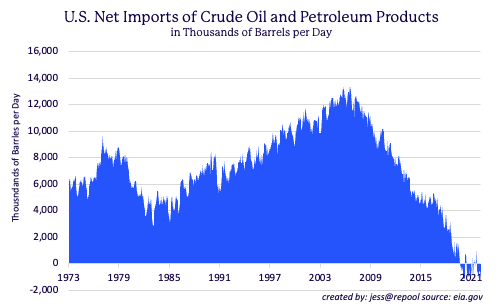
You can see the net-import relationship trend toward negative territory in the 2010s. This reversal was driven by the early 2000s’ shale revolution which helped the U.S. overcome its reliance on foreign crude.
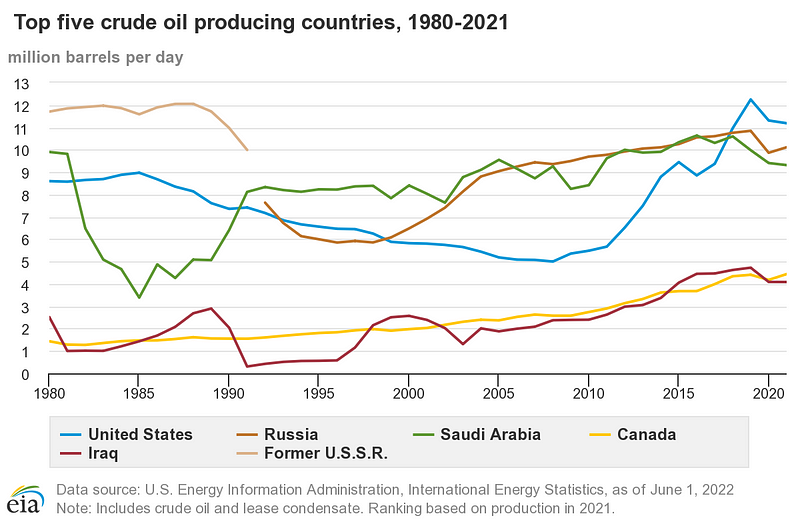
OPEC (Organization of Petroleum Exporters) is another major influencer of international oil prices. 13 member nations comprise this group, which is often described as a cartel given their outsized market influence.
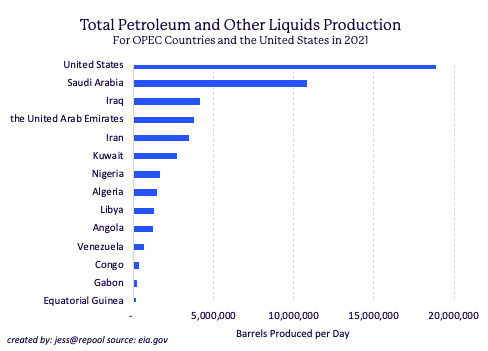
Saudi Arabia, the leading force behind OPEC, currently holds claim to the world’s second largest amount of proven reserves.
Venezuela has the most proven oil reserves, but corruption and corporate mismanagement have significantly impeded their production.
What are proven reserves?
How do you measure how much of an asset you own, if that asset is buried deep underground and invisible to the naked eye?
Turns out not all oil reserves are treated equally. Below, you can see how the quality of reserves are classified by their likelihood of extraction
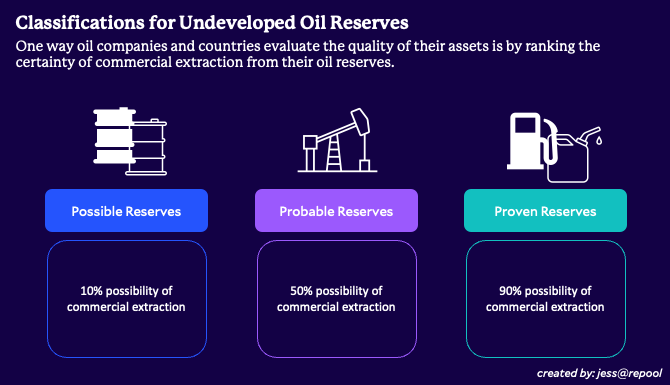
Proven reserves is the highest classification for undeveloped oil reserves. As such, Saudi Arabia’s expansive assets are considerably more valuable.
Alright, you’ve met the most relevant countries — who are the companies behind the barrels?
Big Oil
When you’re deciding where to invest, it’s important to understand the key functions of each corporation. Not all oil companies are made equal.
The Oil Value Chain
The oil value chain helps divide the oil and gas industry into three major subsectors: upstream, midstream, and downstream. Here’s a quick overview.
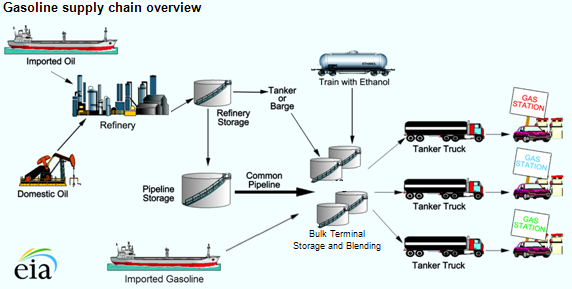
Many companies have fully or partially integrated portions of the oil value chain through organic growth and M&A. There are standalone operators, but many of the big names you’re familiar with are involved across the chain.
Upstream
Colloquially, upstream oil and gas operators are termed “E&P” companies, short for Exploration and Production.
This subsector is focused on the early stages of the oil production process. Similar to an R&D department, upstream folks are focused on the exploration, drilling, and excavation of crude.
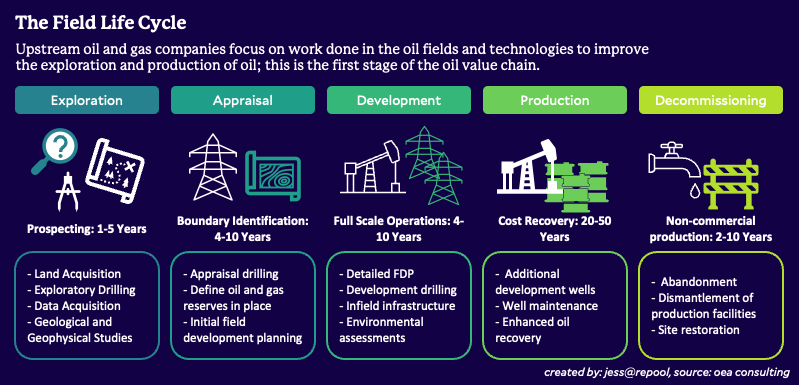
This is an extremely time and capital intensive process — to produce more oil you can’t just “turn it up”. Easing supply shortages through increased domestic production requires time and significant investment.
The other issue is corporate greed running historically high profit margins in a contracting economy and crushing average consumers…but who’s counting?
Midstream
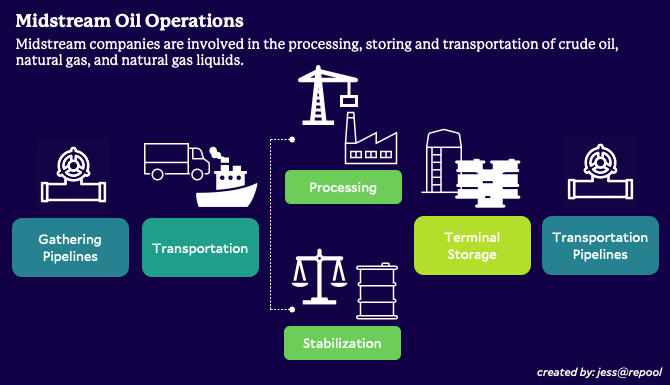
Sometimes called “pipes” companies, midstreamers are responsible for the storage, processing, and transportation of crude oil and natural gas.
There’s a lot of infrastructure involved in this phase: pipeline development, oil tankers, barges, trucks and rails.
Downstream
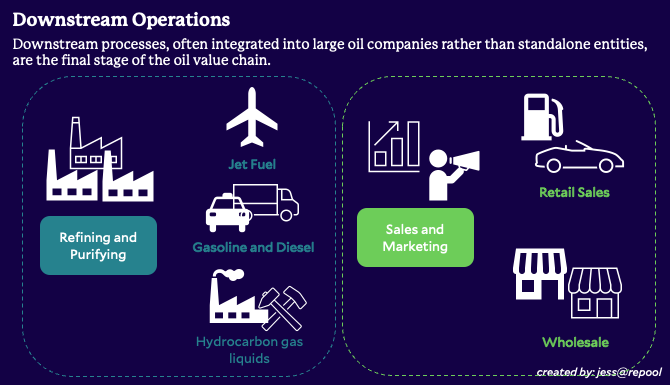
Often referred to as “refiners”, these companies oversee the final production stage when crude oil is processed and distilled into usable petroleum products for consumption.
Tied into this process are sales, distribution and marketing, although some break out these functions into their own subindustry.
We’ve largely stuck to public oil companies so far. Of course, you can also trade the physical asset — which is far riskier and involves very different (and less intuitive) market behavior.
Trading Oil
Unlike equities, commodities are a physical market. At expiry, the buyer is required to take physical delivery of the asset unless other arrangements have been made.
As such, a popular way to trade oil is via the futures markets where investors can get exposure without needing to receive or deliver the actual asset.
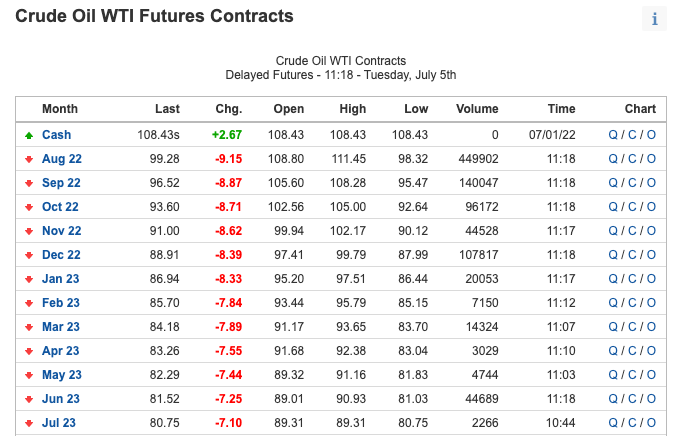
Futures are exchange listed contracts that give you the ability to “roll” a position (i.e. maintain constant exposure to a specific time in the future rather than a single maturity date).
There are two key phenomenon to understand in the oil futures market.
Contango and Backwardation
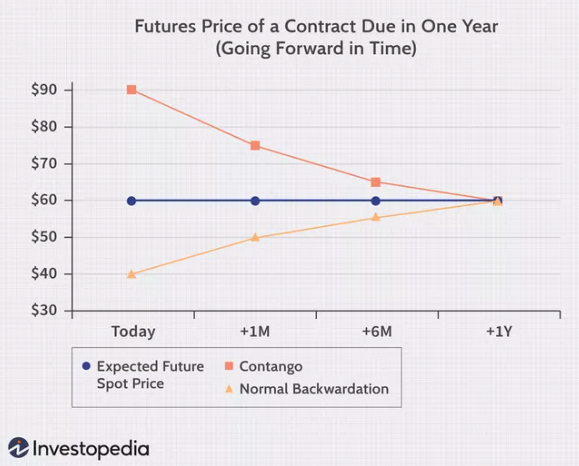
A normal futures curve is upward sloping, indicating that prices will go up over time. An inverted futures curve is downward sloping, reflecting the expectation that prices will go down over time.
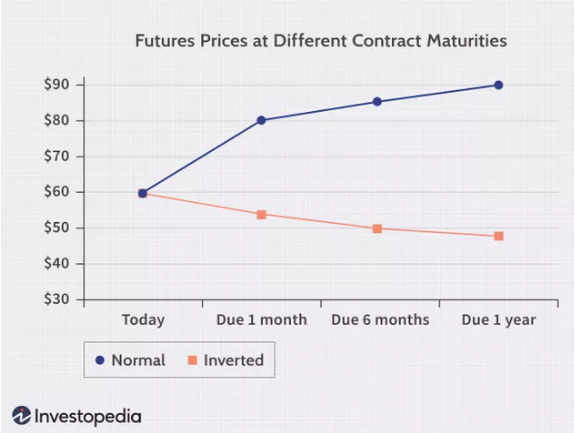
As we near maturity, futures prices converge to spot prices.
The market is in contango when the futures contract price is higher than the expected future spot price. The market is in backwardation when the futures contract price is lower than the expected future spot price.
What is the current futures curve telling us?
Extreme backwardation is seen as a bullish sign for crude, as the future curve reflects an extreme supply shortage causing short-term prices to spike.
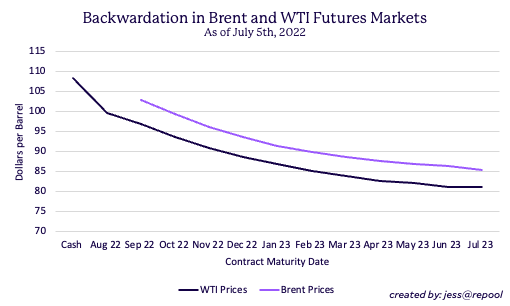
Furthermore, future prices are still at a profitable level for suppliers. The curve inversion also, hopefully, points to a moderation in oil prices in the future.
Conclusion
Some of the biggest players in the futures market are the trading desks of oil producers. Their hedging activity and knowledge of the oil market is not something one can casually, or even diligently, come across as a non-insider.
Although it may sound glamorous to trade oil futures, for the vast majority of investors without industry experience, oil equities are usually more than sufficient energy exposure in your portfolio.

